This section shows how this TCO tool can be used to calculate scenarios for real-life use cases. We address the following 3 cases:
1) Case 1: A standard case of a logistics provider/transportation company that wants to compare the total cost over a period of 6 years between a battery electric vehicle (BEV) vs a Diesel equivalent, taking into account both vehicle related costs as well as required recharging infrastructure for an overnight charging scenario. This case does not further go into details about a specific route/shift, but has general assumptions on daily usage (average distance per day, average usage of toll-related roads, etc.).
2) Case 2: A case where a user wants to use the TCO calculation in order to compare between the option “own recharging infrastructure” vs “pay per use” for the electric vehicle choice. The case therefore re-uses the simple scenario from case 1, but with a higher recharging infrastructure cost (linked to a fast charger), and then compares this with a scenario without this investment cost, but with a higher energy-related price (the actual energy price + a service fee on top). Finally, the scenario simulates where the TCO is break-even.
3) Case 3: A case simulating a 24/7 shuttle service that works with multiple rides within a 24 h cycle. The difference to the previous cases is that there will not be a long enough time window for “overnight charging”, but that the load/unload moments between the trips will be used for recharging the battery. The case looks into two different scenarios, one where there is enough time between trips to fully recharge the battery, an another one where there is additional recharging required at the end of a shift cycle.
Case 1:
For this case, we take the following assumptions:
General assumptions:
- Contract period of 6 years
- Energy-related costs: Electricity= 0,40 €/kWh, Diesel= 1,90 €/l (rounded, incl. 8-10% surcharge for Adblue)
We use a city distribution case with an average of 200 km per day (52 000 km on an annual basis).
For the vehicle size and configuration we use the default values suggested for City distribution, with the following parameters adapted:
The BEV chassis price is 250 000 €, a Diesel version amounts to 84 000 €.
In addition, there is a body equipment cost for both vehicles of 25 000 €.
Maintenance contract for the BEV amounts to 220 euro per month, 300 € for the Diesel equivalent (nearly 30% lower cost for BEV).
Further, we make an important change to the assumption of the residual value for the electric vehicle: 50 000 € (given current uncertainty and based on feedback from market players). The Diesel equivalent residual value is set to 10 000 €.
For recharging of the BEV we use a simple overnight strategy with a depot charger of 22 kW (which for this scenario would be sufficient).
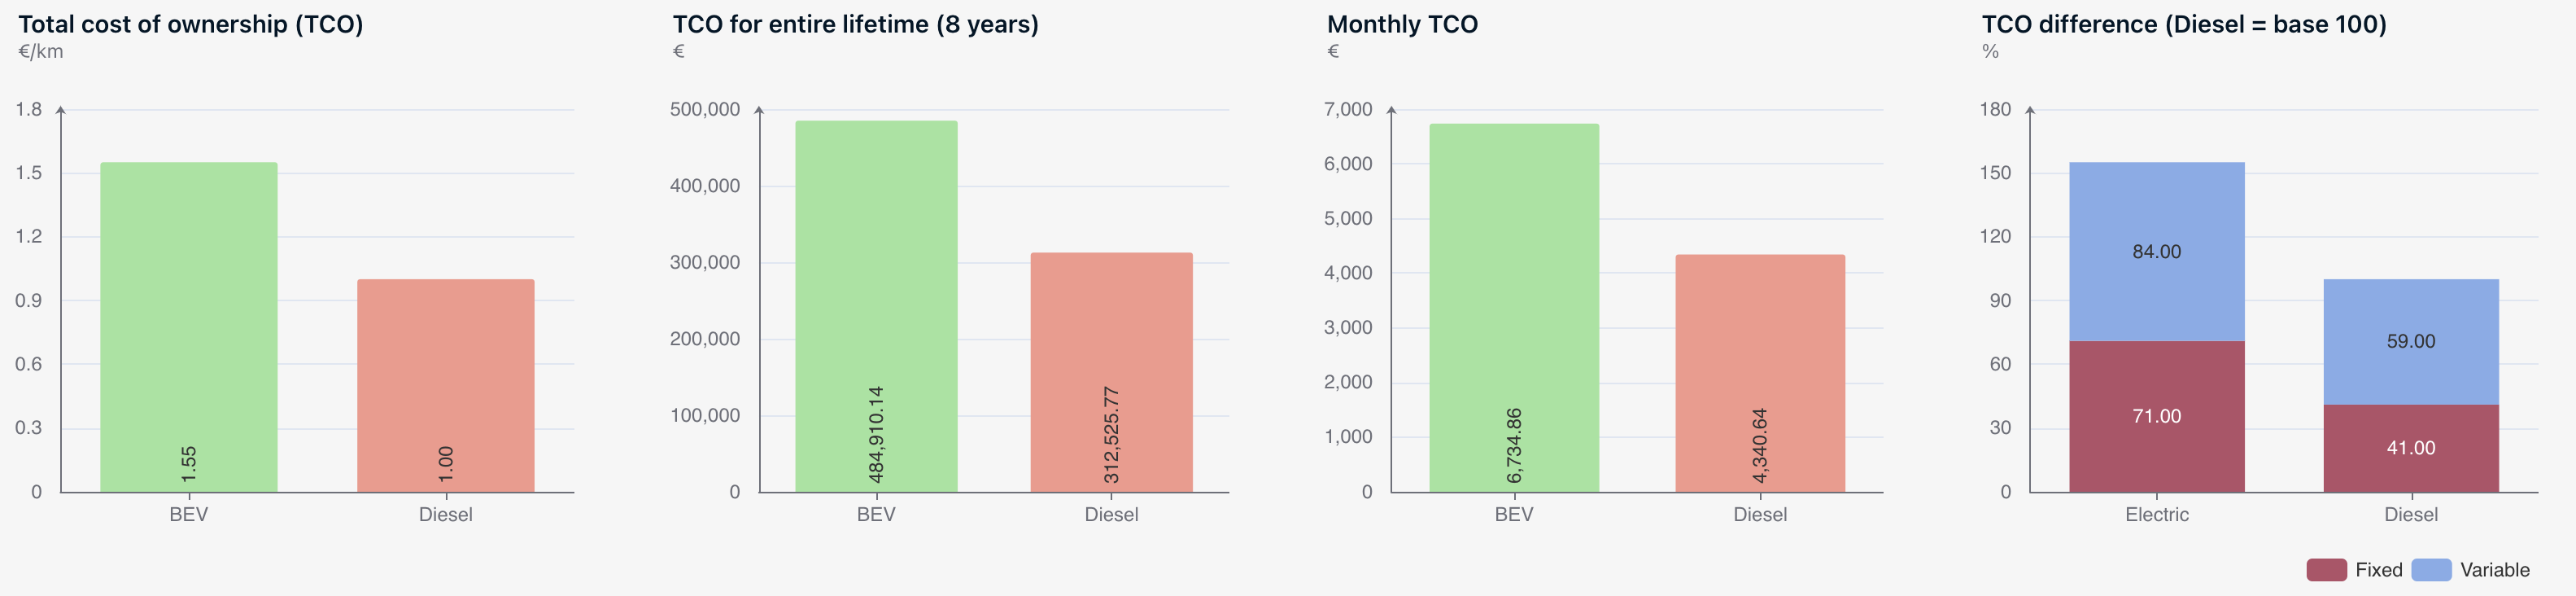
Underneath the outcome of the TCO comparison:
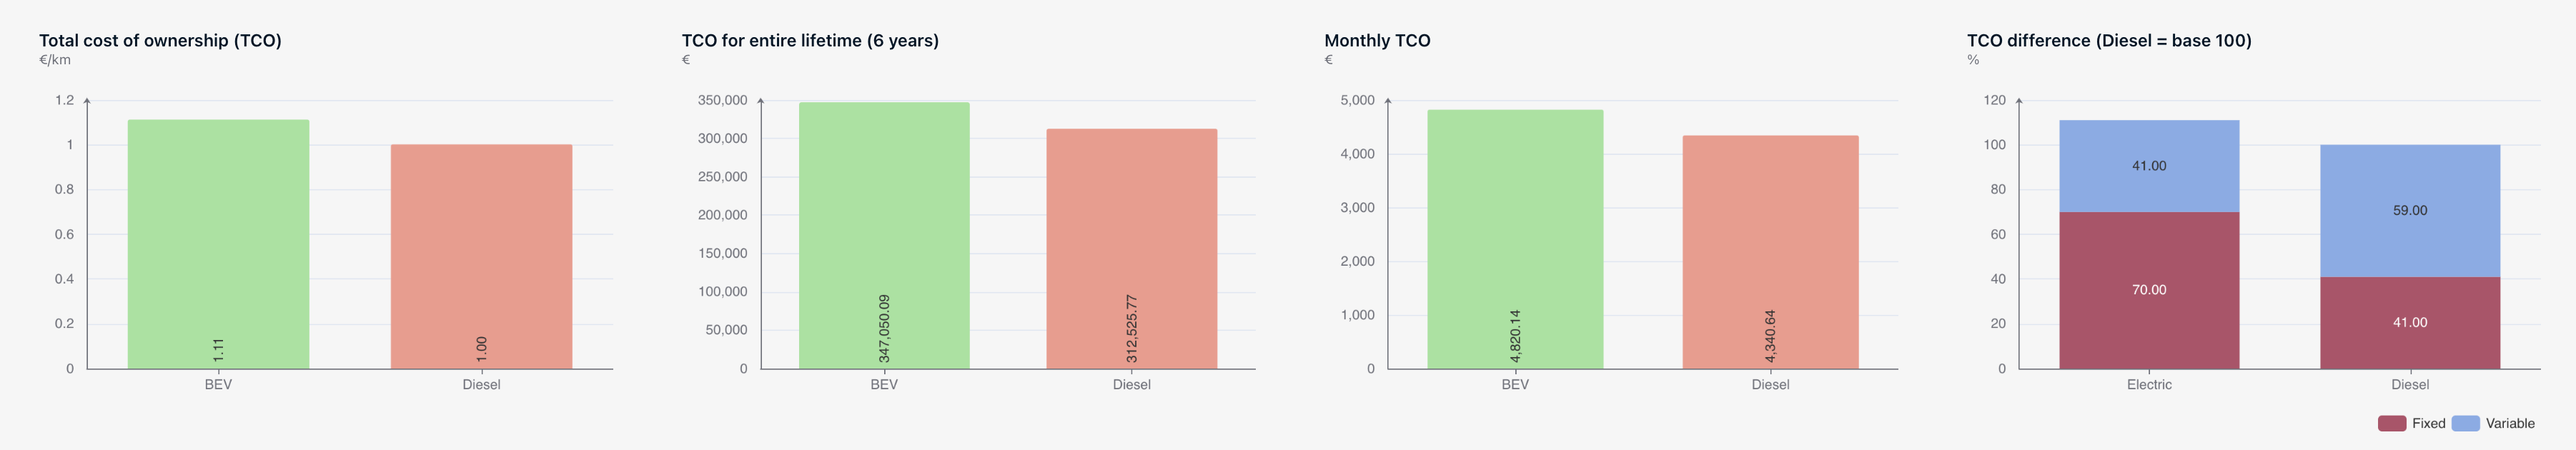
This results in a higher TCO for the BEV being 1,11 €/km compared to 1,00 €/km for the Diesel equivalent.
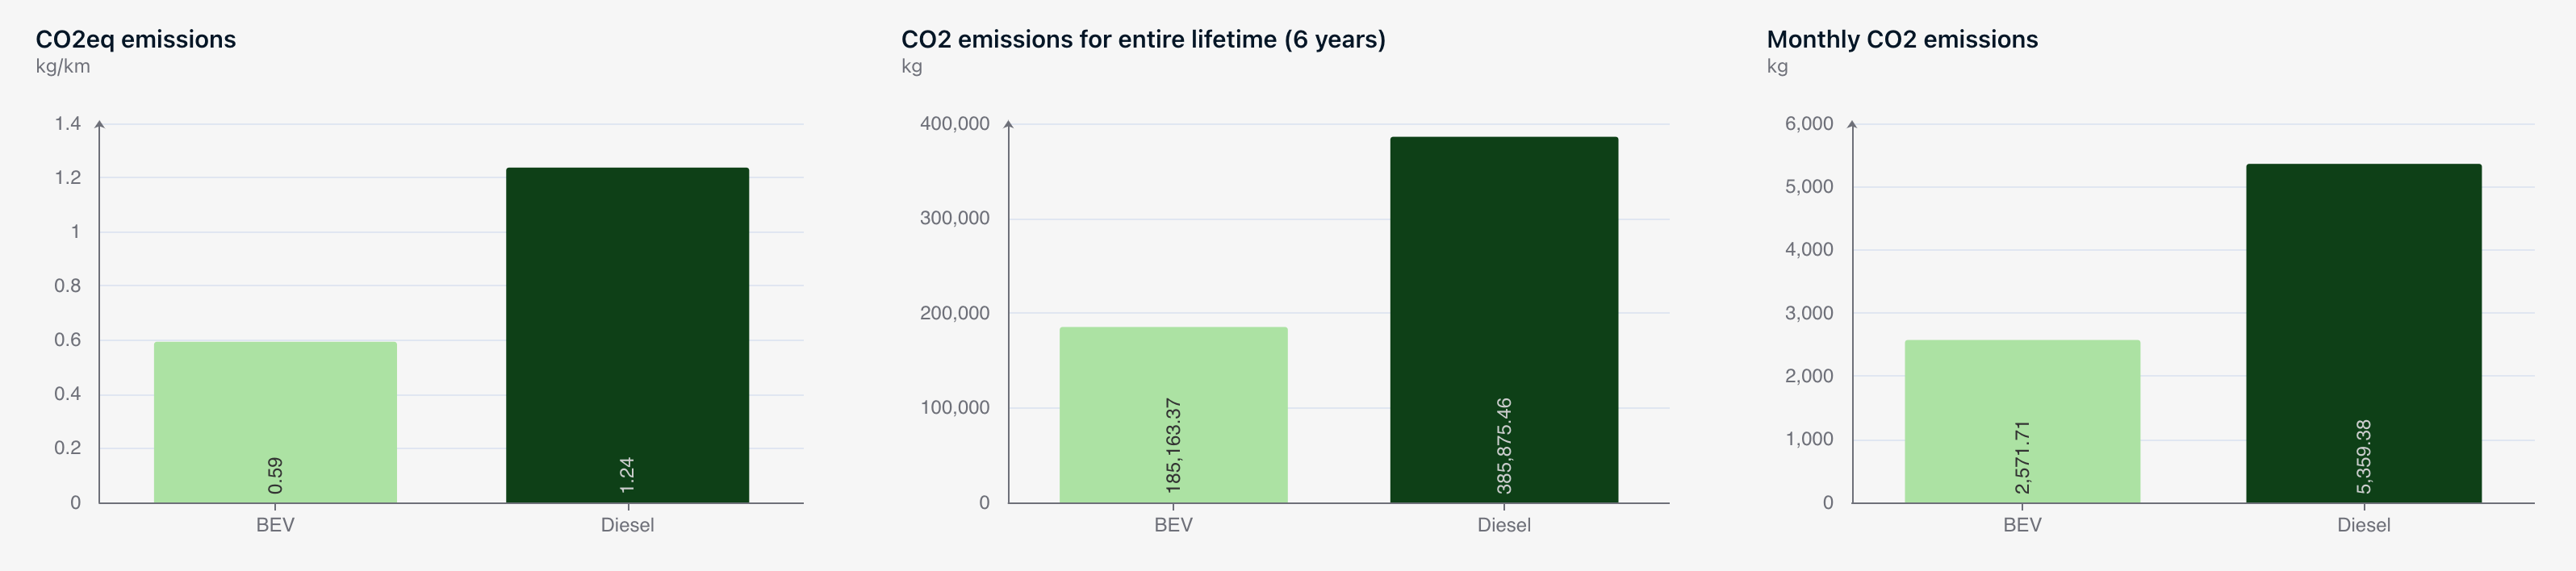
At the same time, the BEV has with 0,59 kg CO2eq/ km a much lower environmental impact (compared to 1,24 kg for the Diesel equivalent), which of the total lifetime results in a total saving of CO2eq emissions of 190 ton CO2eq. If we put both, higher TCO and CO2eq savings into perspective, this can be summarized as a CO2eq cost of 172 € per ton.
Case 2:
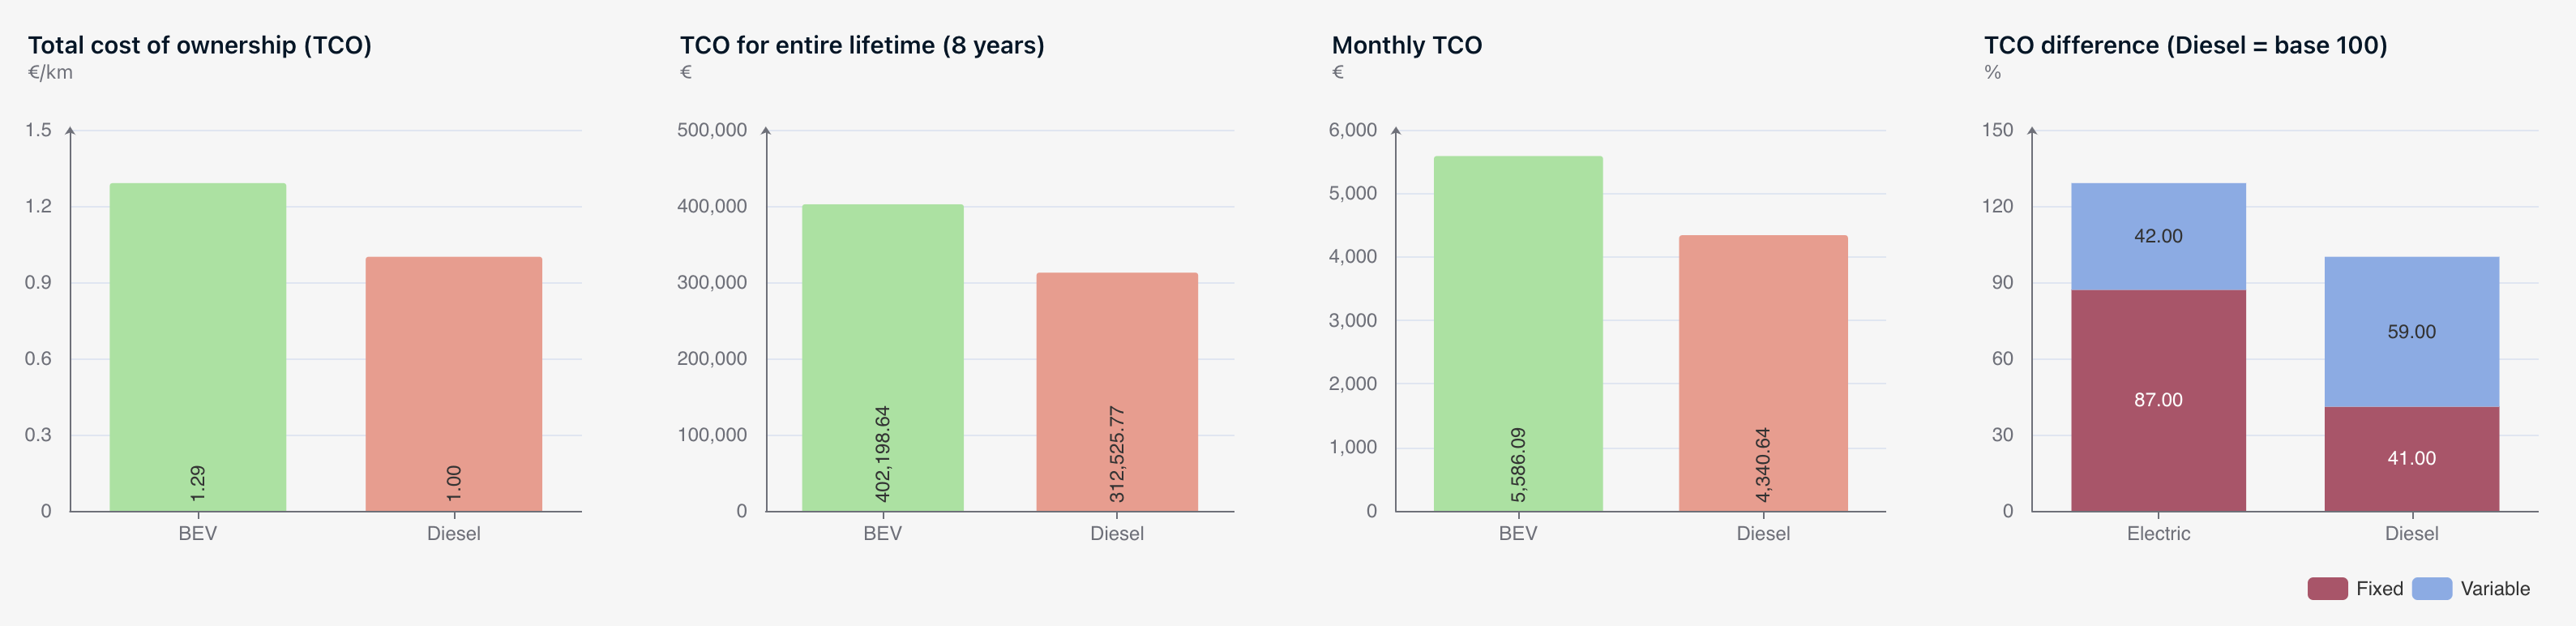
Scenario 1 - Ownership of Charging Infrastructure
In this scenario the company incurs a higher investment cost but a lower operating cost. The cost for investing in the charging infrastructure is set at 130.000 € for a 150 kW DC, and the infrastructure depreciates over 10 years. The electricity cost is 0,40 €/kWh.
Based on this scenario, the BEV has a TCO of 1,29 €/km.
Scenario 2 – Using Public Charging Infrastructure with service fees
In this scenario the company avoids incurring investment cost for the infrastructure but pays a higher price for electricity, due to the service fee of the charging provider. As a first example, let us assume that the surcharge is 0,40 €/kWh on top of the energy price (0,40 + 0,40 = 0,80 €/kWh).
Based on this scenario, the BEV has a TCO of 1,55 €/km, which is 20% higher than in the previous scenario, due to much higher variable costs.
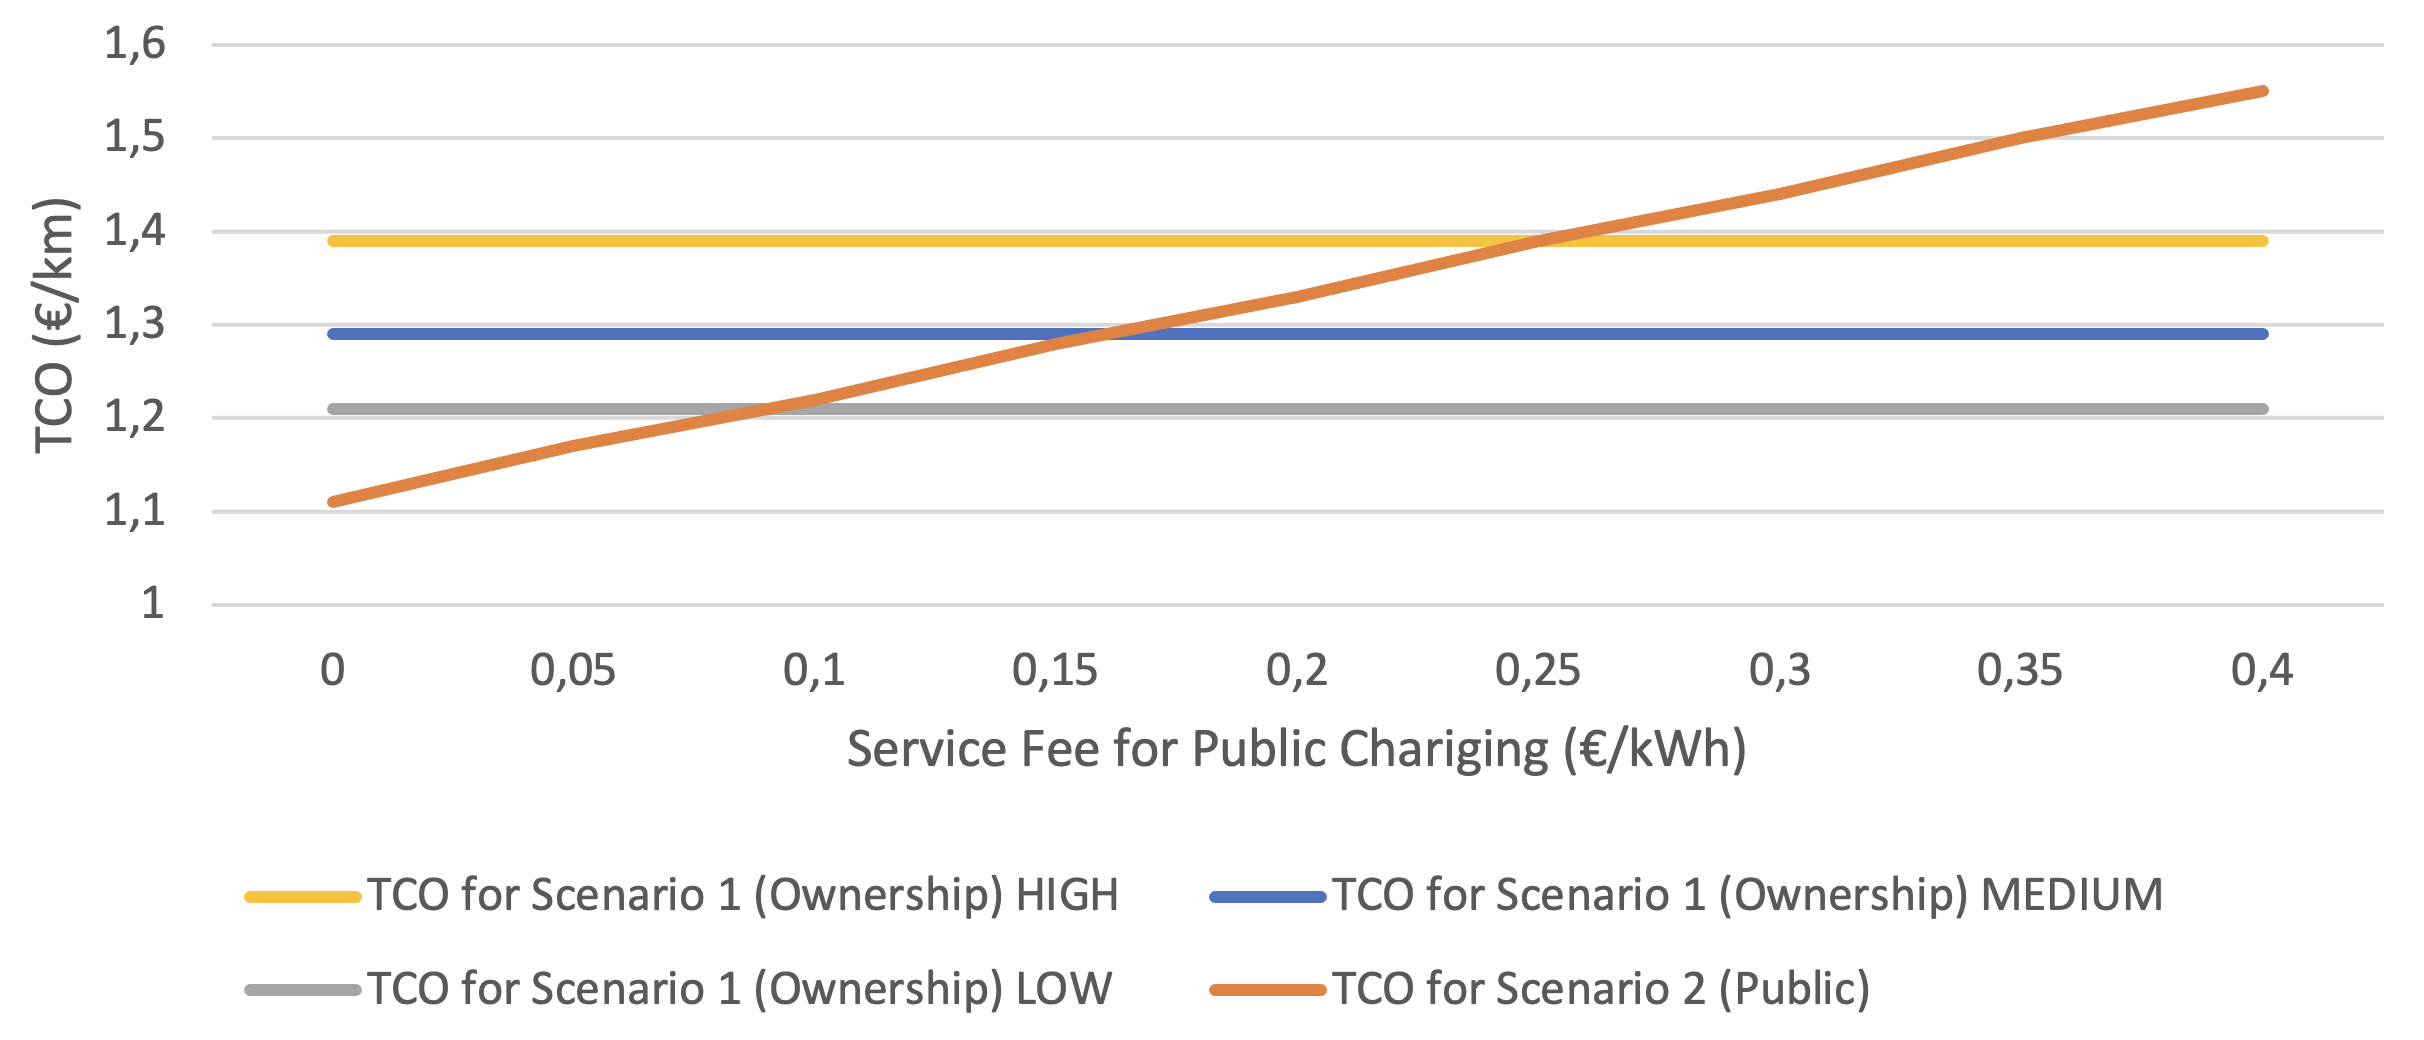
Comparison between the two scenarios
The company can compare the two scenarios based on different electricity prices. If public charging costs more than 0,56 €/kWh (0,16 €/kWh service fee) than the company should consider investing in their own charging infrastructure.
We have also performed a sensitivity analysis with different infrastructure costs. The break-even prices are in the table below. This assumes that the baseline depot charging price is 0,40 €/kWh.
| Scenario | Cost of depot charging | Break-even public charging price | MAX Service Fee | TCO |
|---|---|---|---|---|
| MEDIUM | 130.000 € | 0,56 €/kWh | 0,16 €/kWh | 1,29 €/km |
| HIGH | 200.000 € | 0,65 €/kWh | 0,25 €/kWh | 1,39 €/km |
| LOW | 70.000 € | 0,49 €/kWh | 0,09 €/kWh | 1,21 €/km |
In the MEDIUM scenario, if the Public Service Fee is higher than 0,16 € the company can save on the long term by investing in private charging infrastructure
Case 3:
In this section we address the charging strategy for the electric vehicle. We assume the following:
a) Depot charging power of 150 kW
b) Energy consumption set to the default value of 1.22 kWh/km for a 200 kWh battery
c) Recharging is possible only at the depot for max 30 minutes
d) The shuttle completes roundtrips which are 46 km long
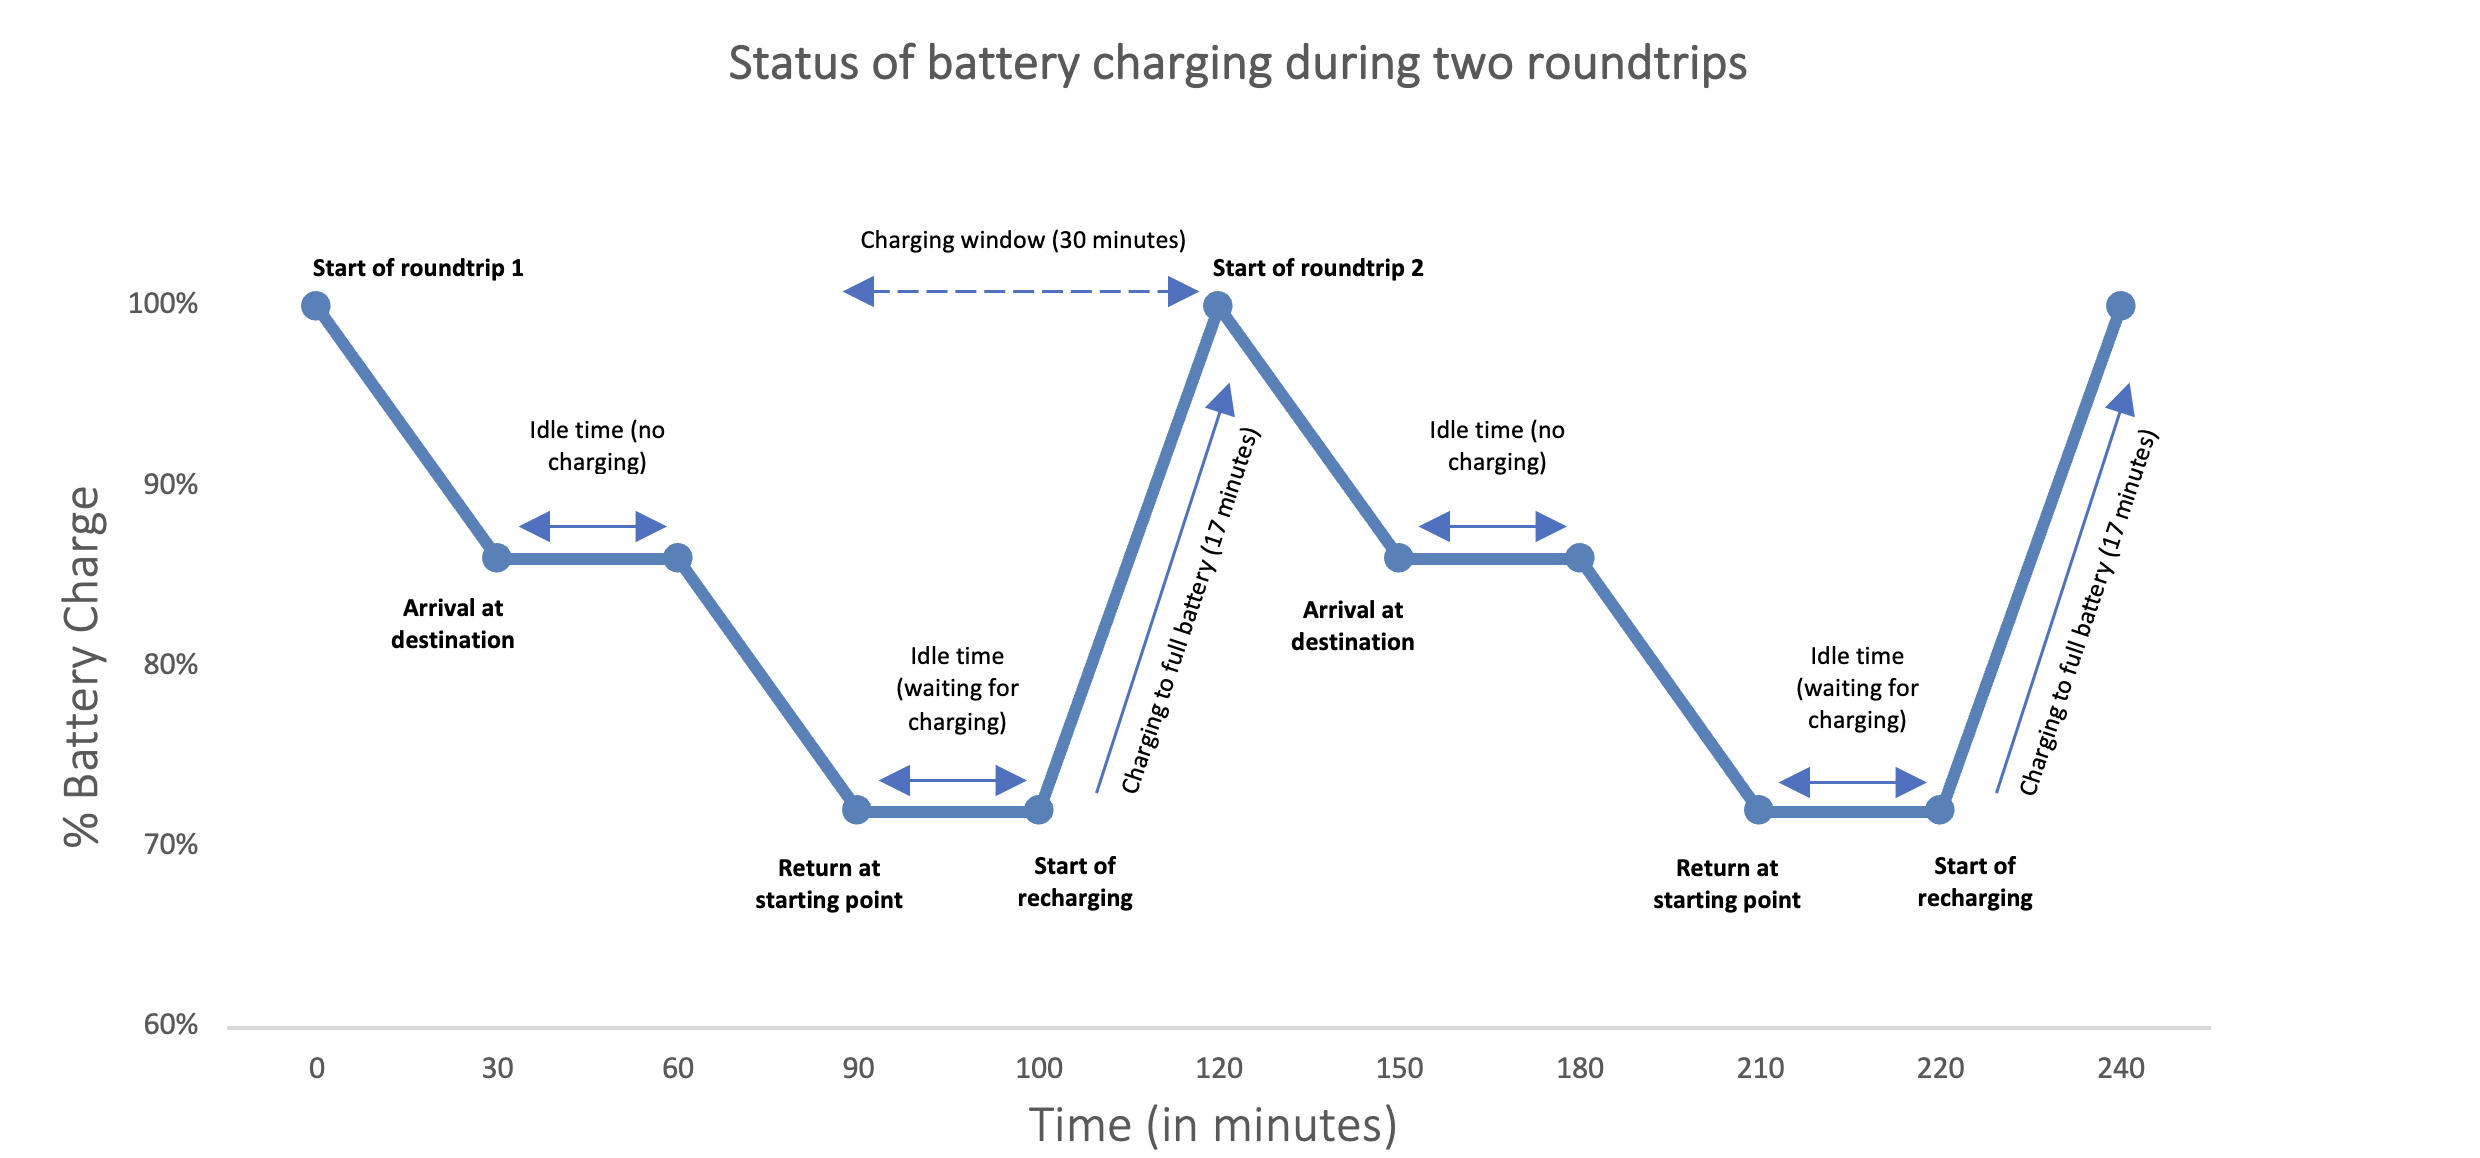
Based on the length of each trip and the consumption, the BEV is consuming about 59 kWh for roundtrip (1.22 kWh/km x 46 km ≈ 56 kWh). As the depot charging power can theoretically charge the battery up to 75 kWh during the 30-minute break, the BEV can be fully recharged after each roundtrip. Assuming linear charging of the battery, the time required is shorter than 30 minutes (about 17 minutes).
The chart below shows the status of charge of the battery at different stages of the roundtrip, including idle time during the drop off at destination and the time that can be spent waiting to start recharging.
Alternative scenario
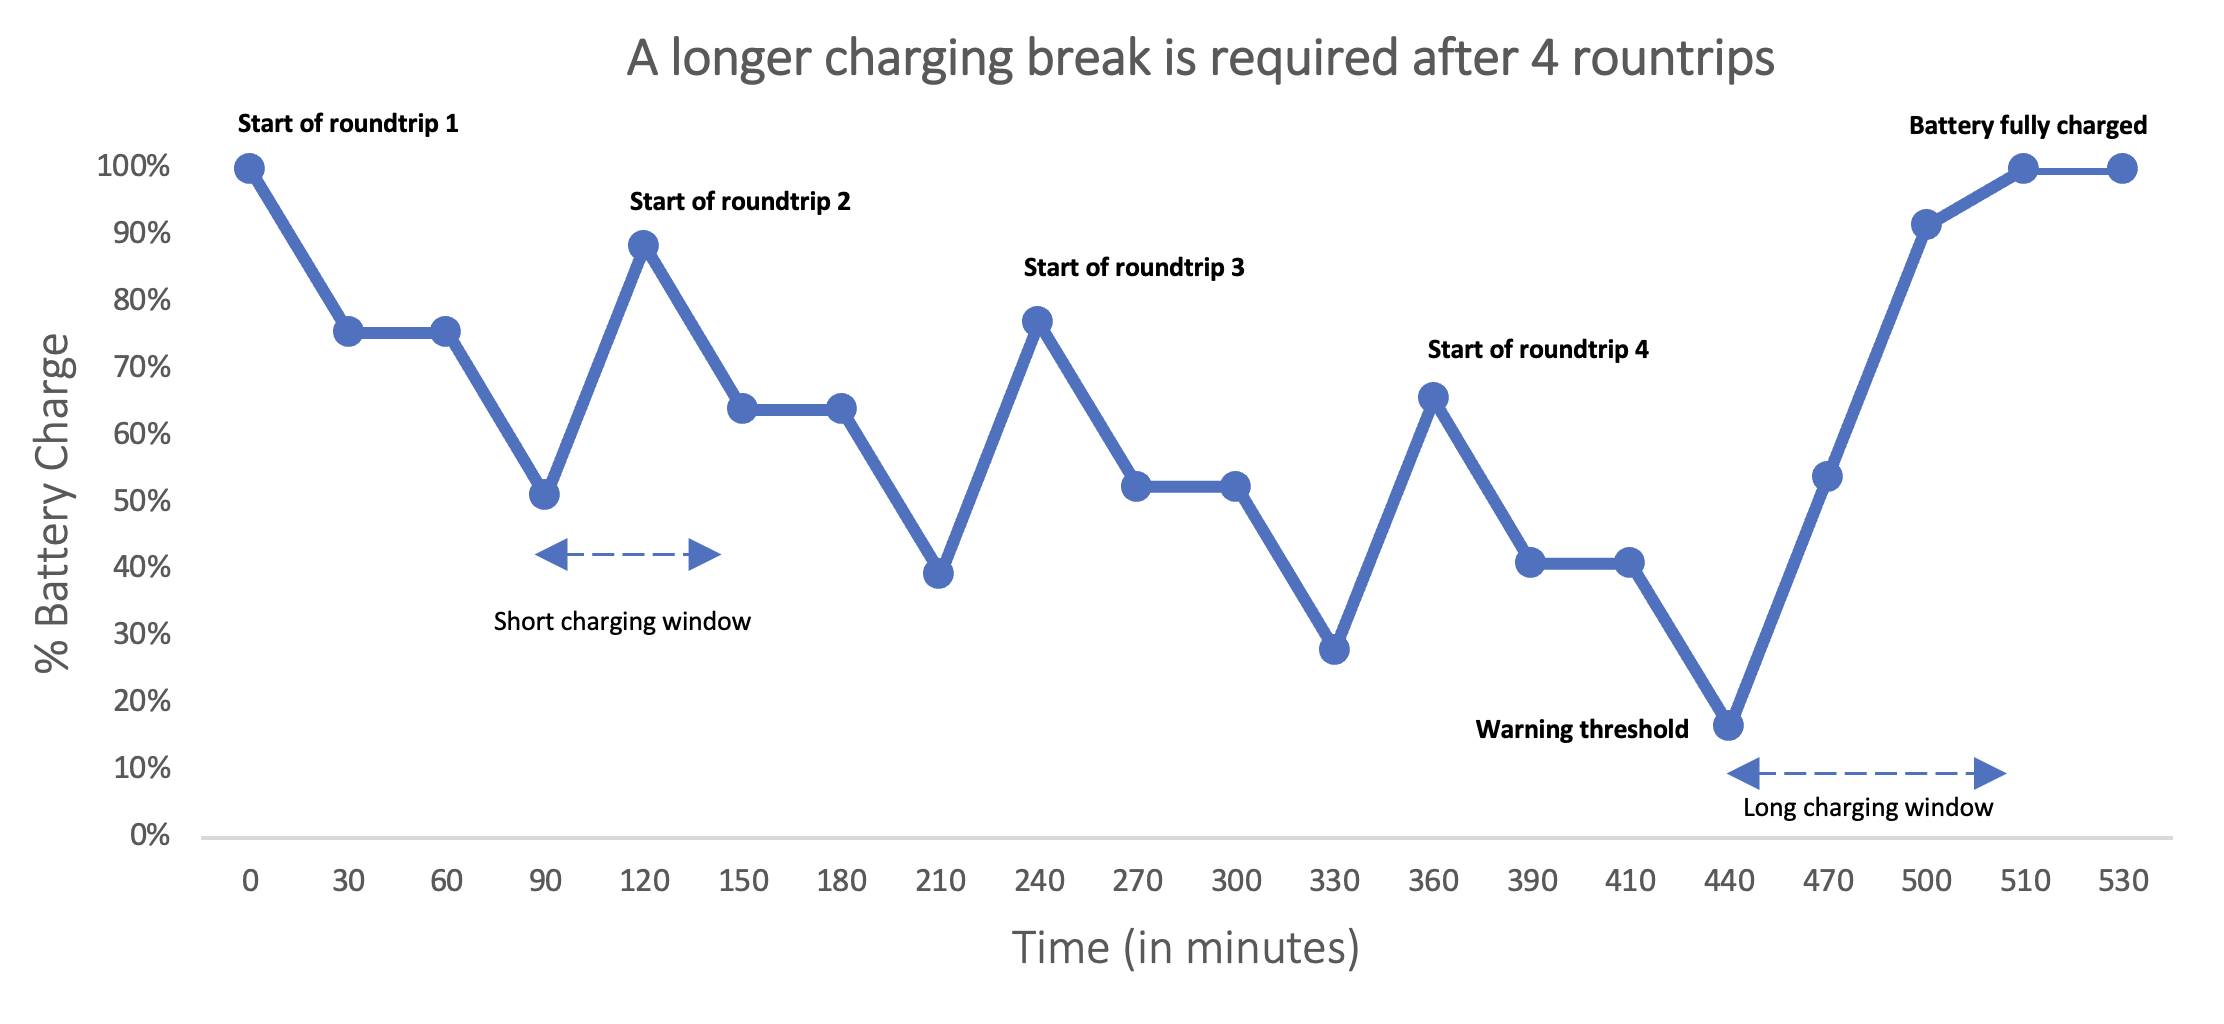
In this alternative scenario, we assume that the roundtrip is 80 km long. In this case, the energy consumption is 98 kWh (1.22 kWh/km x 80 km ≈ 98 kWh) and therefore the battery cannot be charged to 100% after each roundtrip.
At some point, the battery will reach the 20% charge warning threshold, requiring a longer charging event to fully charge. As the chart below shows, the longer charging event should be scheduled after 4 roundtrips. This will require a longer 40 minutes recharging window to charge the battery at full.